
Data Mining with Rattle for R
dementia data-mining R-stats Data mining tools make it easy to get a quick overview of the data we’re working with which can save us loads of time, especially if we’ve got many predictors to investigate. One of the best things about these tools is that a lot of them are open-source and available for free (you can find a list of some of those here).
In this brief post, I’ll introduce a data mining tool based on the R statistical programming language called Rattle. We’ll use it to take a look at the raw dataset we constructed in a previous post using open-source data from the Allen Institute for Brain Science’s Aging, Dementia, and TBI Study.
Installing and Starting Rattle
Most of the time, I like to use an Anaconda distribution of Jupyter Lab to write and run scripts in R. For installing and running Rattle, though, I’m using the command-line interface (“Anaconda Prompt”; I’m on a PC running Windows 10). After navigating to my favorite directory, I type R after the prompt to start the R terminal:
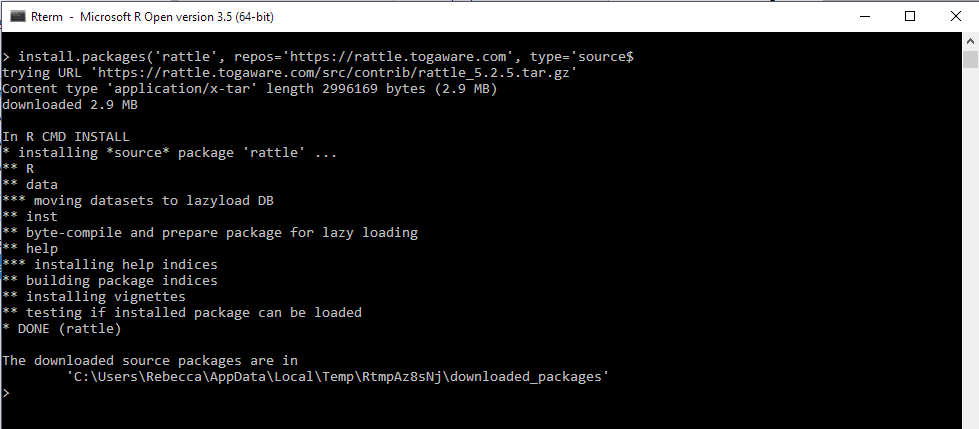
Rattle is made by Togaware and we can get it directly from their site by entering the following line of code in front of the prompt.
install.packages('rattle', repos='https://rattle.togaware.com', type='source')
Once installed, we load the library…
library(rattle)
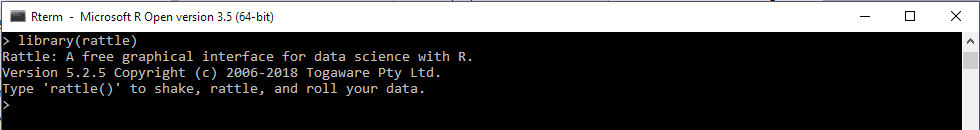
…and start the graphical user interface using the following command…
rattle()
Loading Data & Looking at Distributions
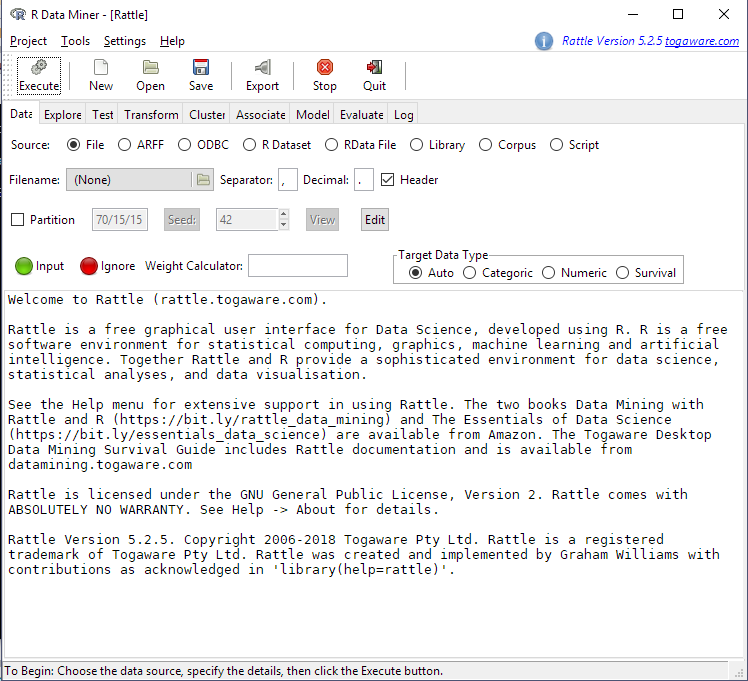
I saved a CSV version of the dataset we made at the end of this blog post. It consists of genetic, pathological, demographic, and medical history data for 107 study participants. We’ll load it into Rattle by locating the file and pressing the “Execute” button in the top left corner.
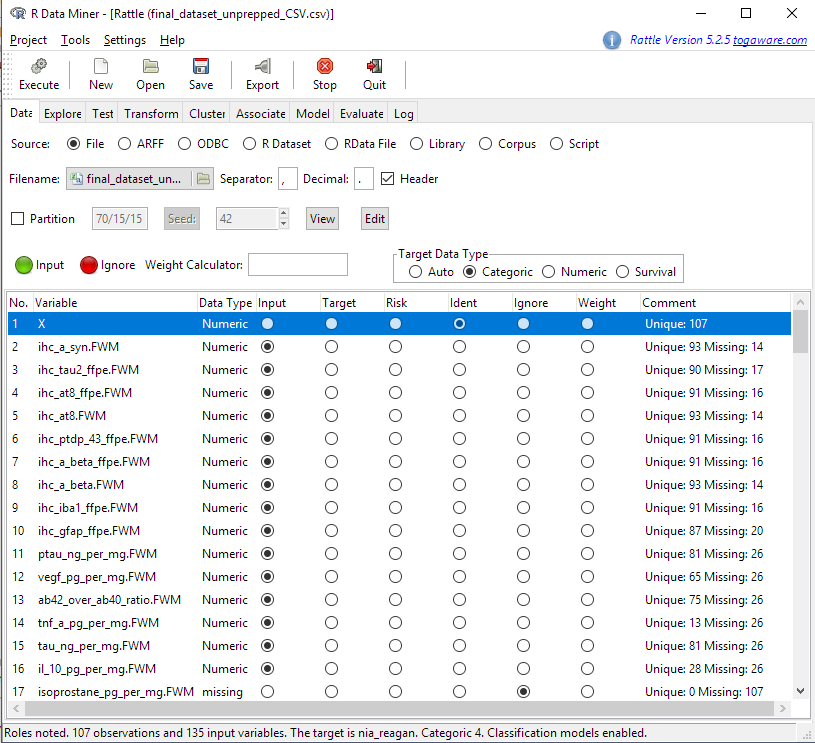
Rattle makes an initial guess at data types and variable purposes (input, target, etc.). If we wanted to recode any variables as a different type (i.e. make a numeric variable into a categorical one or vice versa), we can do that on the Transform tab. We can change the variable purposes in the Data tab. For example, Rattle makes the last column in the table the Target variable. In this case, the last column is the nia_reagan variable, which encodes a pathological Alzheimer’s diagnosis of the patient made post-mortem according to a specific set of criteria. We want to make the Target act_demented, which takes the values “Dementia” or “No Dementia”. To do this, we use the buttons to make nia_reagan an Input variable and act_demented the Target. Then we press Execute again.
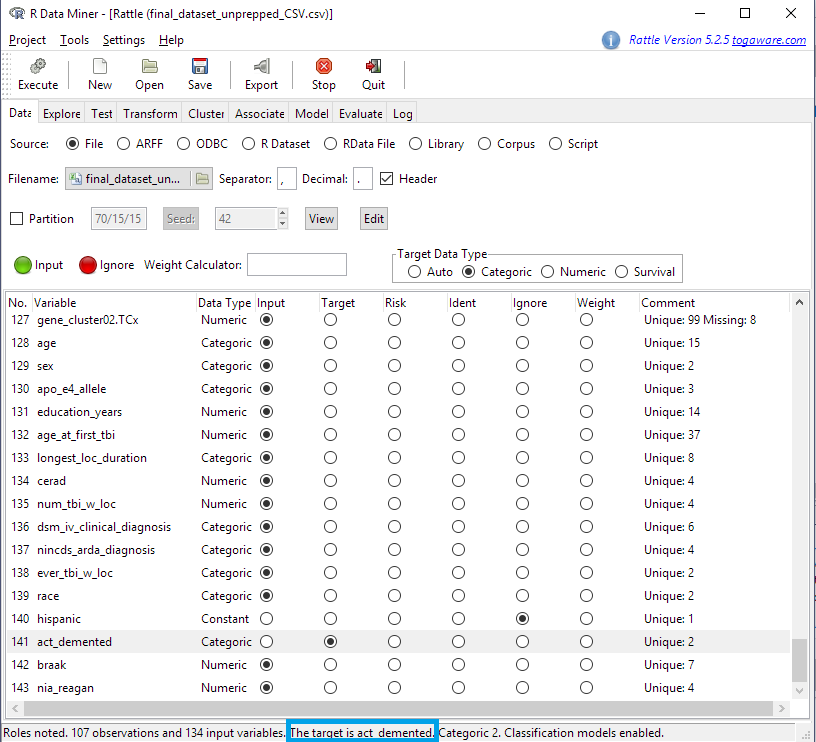
The note at the bottom of the window indicates the change we made.
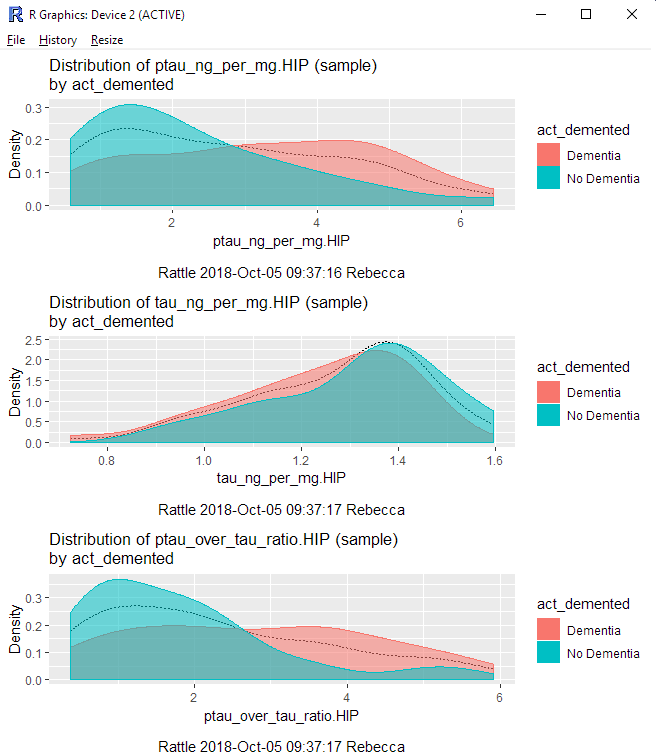
Let’s say we want to get a quick look at the distributions of some of the numeric variables. We click on the Explore tab (blue arrow in the screen shot below) and select Distributions (orange box). We’ll take a look at three numeric variables (pink boxes) from hippocampus (HIP) brain samples:
- The amount of phosphorylated tau protein -
ptau_ng_per_mg.HIP - The amount of unphosphorylated tau -
tau_ng_per_mg.HIP - The ratio between phosphorylated and unphosphorylated tau -
ptau_over_tau_ratio.HIP
We’ll group the variables according to our Target, act_demented (brown box below).
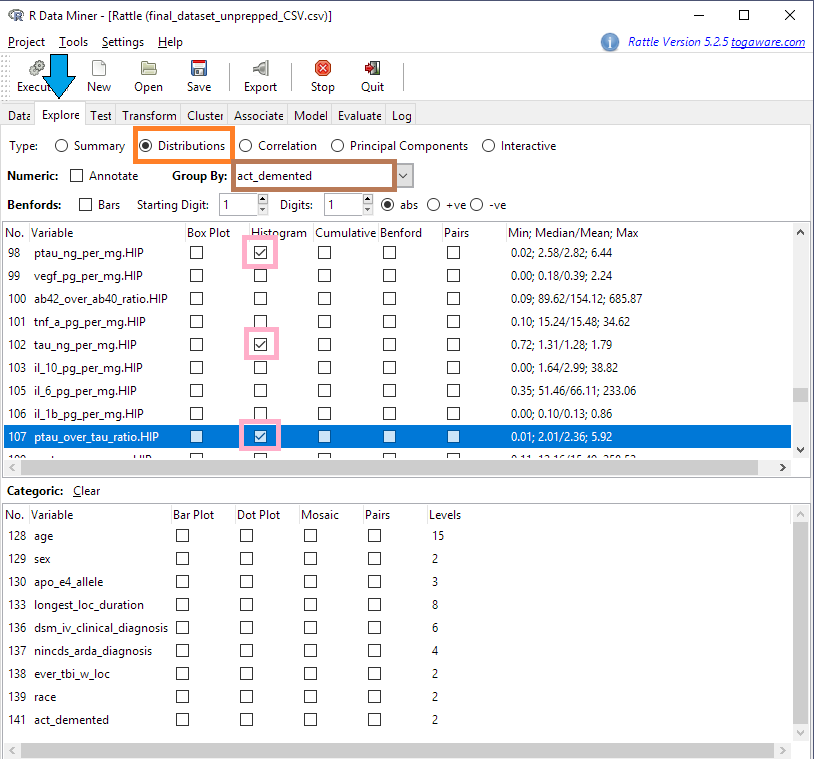
Clicking Execute opens a new window with histograms for the variables we selected.
While I find Rattle to not be as sophisticated as some other data mining tools (Orange for Python, SAS Enterprise Miner), it is great for getting a peak at data if I’m working in R.
Thanks for reading and happy data mining!